A Marriage Made in Heaven: Search and BI
Here’s a marriage made in heaven: combine search and business intelligence (BI) to create an easy-to-use query environment that enables even the most technophobic business users to find or explore any type of information. In other words, imagine Google for BI.
Search offers some compelling features that BI lacks: it has a brain-dead easy interface for querying information (i.e. the keyword search box made famous by Google and Yahoo); it returns results from a vast number of systems in seconds; and it can pull data from unstructured data sources, such as Web pages, documents, and email.
Of course, search lacks some key features required by BI users: namely, the ability to query structured databases, aggregate and visualize records in tabular or graph form, and apply complex calculations to base-level data. But imagine if you could build a system that delivers the best of both search and BI without any of the downsides?
Given the potential of such a union, a variety of vendors have been working for years to consummate the relationship. Some are search vendors seeking to penetrate the BI market; others are BI vendors looking to make good on the promise of self-service BI; and others are entrepreneurs who believe linguistic technology can bridge the gap between search and SQL.
Here are three approaches vendors are taking to blend search and BI technologies.
1. Faceted BI Search
Faceted BI search—for lack of a better term—is a pureplay integration of search and BI technologies. Information Builder’s Magnify is perhaps the best example of this approach, although Google has teamed up with several BI vendors to offer a search-like interface to structured data sources.
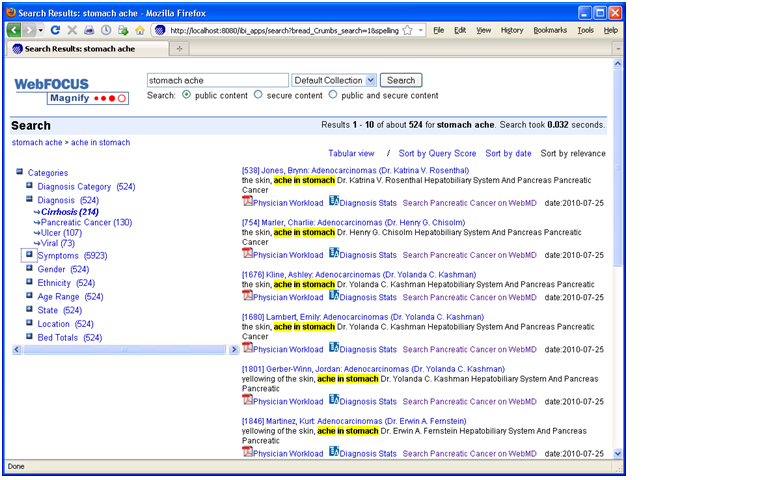
Here, a search engine indexes metadata and data generated by an ETL or reporting tool. When users type a word into the keyword search box, they receive a list of search results in the main body of the page and “facets” (i.e. categories of topics derived from metadata) in the left-hand column (see figure 1.) The results contain links to records in the source systems and reports that are executed on the fly using parameters from the search metadata. Users can also click on the facets to view subcategories and refine their search. Each time they click on a category or subcategory, a new set of result entries appear in the main body of the page.
Figure 1. Faceted Search

Information Builder, Inc.’s WebFocus Magnify is a BI Search product that indexes metadata and data generated by IBI’s ETL tool. The tool’s search engine displays search results in the main body of the page and dynamically generated “facets” or categories in the left-column. The search results contain links to reports that are dynamically generated based on search metadata. Source: Information Builders.
Prior to Faceted BI Search, comparable tools only indexed a BI vendor’s proprietary report files. So you could search for prerun reports in a specific format but nothing else. In contrast, Faceted BI Search dynamically generates reports based on search parameters. Furthermore, those reports can be interactive and parameterized, enabling users to continue exploring data until they find what they are looking for. In this dynamic, search becomes a precursor to reporting which facilitates exploration and analysis. So, the end user process flow is: searchàreportàexplore.
In addition, compared to prior generations of BI Search, Faceted Search indexes any content defined in metadata and fed to the search engine, including relational data, hierarchical data, documents, Web pages, and real-time events streaming across a messaging backbone. As such, the tools serve as surrogate data integration tools since they can mingle results multiple systems, including structured and unstructured data sources. It’s for this reason that in the past I’ve called Faceted Search a “poor man’s data integration tool.”
2. NLP Search
A more sophisticated approach to marrying search and BI involves natural language processing (NLP). NLP uses linguistic technology to enable a computer to extract meaning from words or phrases, such as those typed into a keyword search box. NLP breaks down the sentence structure, interprets the grammar and phrases, deciphers synonyms and parts-of-speech elements, and even resolves misspellings on the fly.
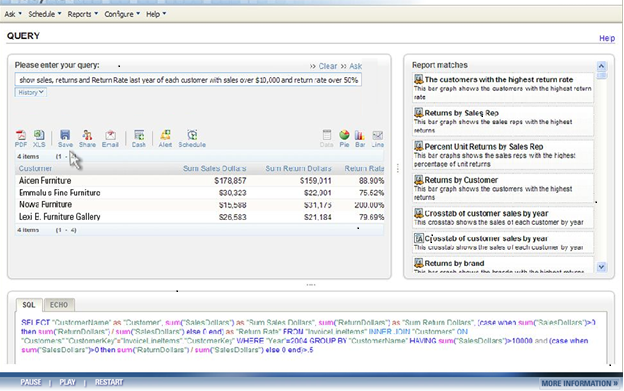
From there, the technology maps the meaning derived from keywords to metadata that describes the content of a database or document. Once this mapping occurs, the tools generate SQL queries against a database schema. All this happens instantaneously, so users can iteratively query a database using plain English rather than SQL or a complex query tool. (See figure 2.)
Figure 2. NLP Search

When users type a query in plain English into an NLP search box, the system suggests related reports (right pane) and hints (not shown) to refine the search. The system then maps the words to underlying database schema and generates SQL (bottom pane) which return the results (left pane), which can then be converted into a table, chart, or dashboard. Source: EasyAsk.
To make the translation between English words and phrases to SQL, the tools leverage a knowledgebase of concepts, business rules, jargon, acronyms, etc. that are germane to any business field. Most NLP tools come with knowledgebase for specific domains, including functional areas and vertical industries. Typically, NLP Search customers need to expand the knowledgebase with their own particular jargon and rules to ensure the NLP tools can translate words into SQL accurately. Often, customers must “train” a NLP Search tool on a specific database that it is going to query to maximize alignment.
While NLP tools may be a tad fussy to train and manage, they come closest to enabling users to query structured data sources. Ironically, despite their linguistic capabilities, the tools usually don’t query unstructured data sources since they are designed to generate SQL. Perhaps this limitation is one reason why pioneers in this space, EasyAsk and Semantra, have yet to gain widespread adoption.
3. Visual Search
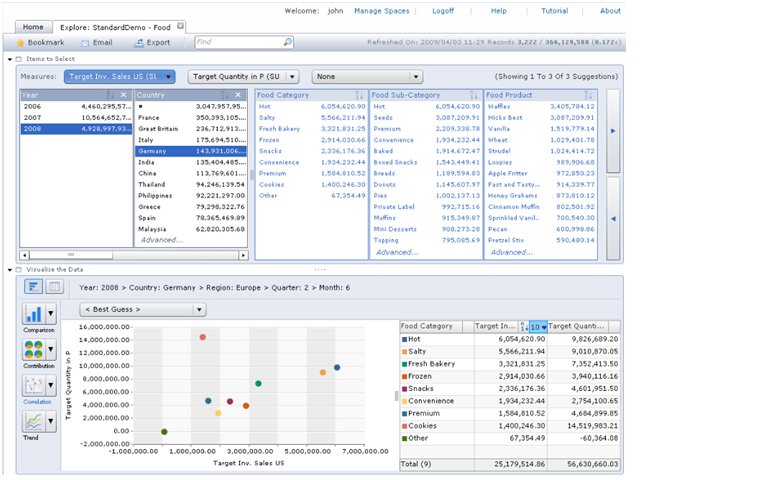
The third approach doesn’t use search technology per se; rather, it mimics the effects of search using advanced BI tools. This type of BI Search runs a visualization tool directly against an analytic platform, usually an in-memory, columnar database with an inverted index that offers blindingly fast query performance. The combination of visualization and in-memory database tools enables users to explore sizable volumes at the speed of thought. Using a point and click paradigm, users can sort, filter, group, drill, and visual data. (See figure 3.)
Figure 3. Visual Search

SAP BusinessObjects Explorer Accelerated marries a visualization tool with an analytic appliance (i.e., in-memory columnar database on an MPP machine) that enables users to “search” large volumes of data in an iterative manner. A user begins by typing a phrase into the keyword search box atop, which is used only to define the “information space” (i.e., the star schema) whose data will be exposed through the visual interface. Source: SAP.
Compared to Faceted BI search, which we described earlier, this approach eliminates the intermediate step of delivering individual search results or entries to users who then have to scan the entries to find one that is relevant and then click on a link to a related report. Instead, Visual Search links data directly to a visual analysis tool, giving users direct access to the information they are looking for along with the ability to dynamically interact with the data.
SAP BusinessObjects Explorer (and the recently announced Explorer Accelerated) and Endeca’s Information Access Platform are examples of Visual Search. While SAP BusinessObjects Explorer runs against star schema databases (primarily SAP BW InfoCubes today but heterogeneous databases in the near future), Endeca runs against both structured and unstructured data sources, which befits is origins as a search applications vendor.
Conclusion
BI Search is bound to gain traction in the BI market because it meets an unmet need: the ability to give casual users (i.e., executives, managers, and front-line workers) an ad hoc query tool that is simple enough to use without training.
Today, most self-service BI tools are too hard to use. And although a well-designed performance dashboard should meet 60% to 80% of the information needs of casual users, they don’t suffice for the other 20% to 40% of occasions when casual users need true ad hoc access to various information sources. Blending the best of search and BI technologies, BI search tools will fill this void.
Posted by Wayne Eckerson on August 31, 2010