Data Stories: National Parks, Mountaineering, Tracking Terrain
Using mapping software to show park locations, Tableau to explore hiking data, and eye tracking to discover how people navigate.
- By Upside Staff
- May 4, 2022
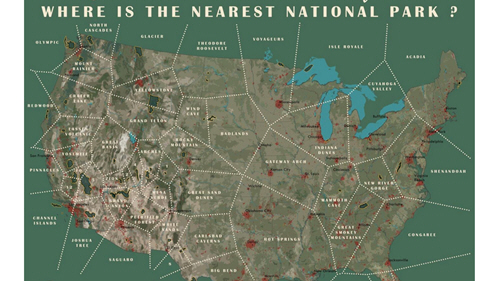
This article walks through the creation of a map that shows the closest National Park to any point in the U.S.
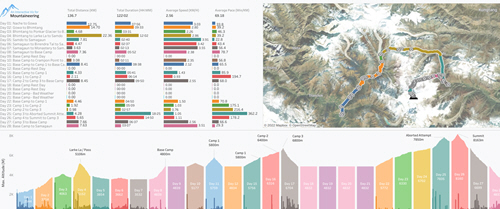
Mountain climbing can be tracked in multiple ways, including distance, altitude, and traveling speed. This interactive site allows viewers to explore several expeditions in detail (switch the trip location from the top of the page).
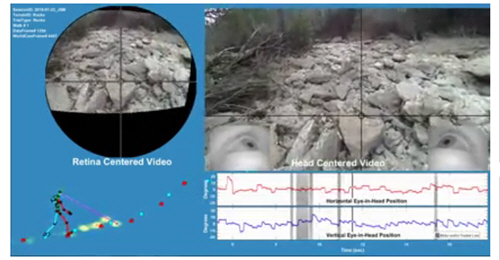
Have you ever wondered how humans navigate rocky terrain? This video illustrates a recent study. The full research paper is also available.