
Data Stories: Duplicate Bills and Buying Political Influence
These data visualizations show how special interests write legislation and which industries and companies spend the most to lobby the U.S. government.
- By Upside Staff
- June 9, 2021
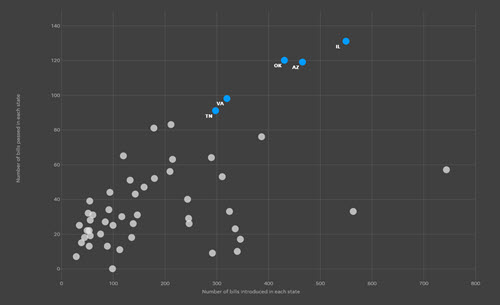
This investigation from USA Today shows how many bills introduced (and often passed) by U.S. state governments are written by special interest groups.
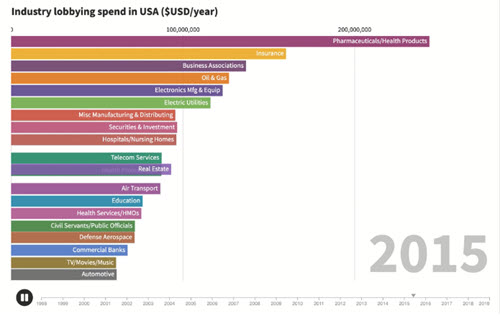
This video illustrates how industries spent more or less lobbying the U.S. government over time.
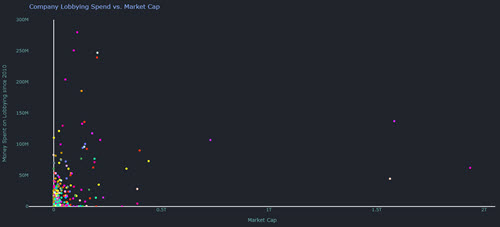
The charts provided by this site also show U.S. lobbying data, first by industry, then by individual company. The second chart (pictured) makes it easy to see which companies are spending more relative to their revenues -- hover over any point for more information.